


-
- Trading Platforms
- PU Prime App
- MetaTrader 5
- MetaTrader 4
- PU Copy Trading
- Web Trader
- PU Social
-
- Trading Conditions
- Account Types
- Spreads, Costs & Swaps
- Deposits & Withdrawals
- Fee & Charges
- Trading Hours


EN
24 July 2025,03:10
Daily Market Analysis
24 July 2025, 03:10


Key Takeaways:
*Persistent trade uncertainty has pressured the greenback, with the U.S. Dollar Index down over 1.2% since Monday, as capital flows rotate out of dollar-denominated assets.
*Easing trade tensions fueled a broad rally in U.S. equities. The Dow Jones jumped more than 500 points, leading gains across major indices. Robust earnings from Alphabet Inc. (GOOGL.O) added to the bullish momentum.
Market Summary:
Following the recently concluded trade agreement between the U.S. and Japan ahead of the August 1 deadline set by President Donald Trump, the European Union is reportedly nearing a similar deal with the U.S., potentially involving a 15% baseline tariff on EU goods—down from the previously threatened 30%.
While negotiators in Brussels aim to secure favorable terms, the looming deadline and ongoing uncertainty surrounding Trump’s trade policy have weighed on investor sentiment toward dollar-linked assets. The U.S. Dollar Index has declined more than 1.2% since Monday, reflecting persistent capital outflows from U.S. equities and bonds.
In contrast, optimism around easing trade tensions has lifted Wall Street sentiment. All three major U.S. indices closed higher in the previous session, with the Dow Jones Industrial Average leading gains—surging more than 500 points. The upbeat momentum was further supported by robust earnings, particularly from Alphabet Inc. (GOOGL.O), which delivered results that beat market expectations and bolstered broader market confidence.
Looking ahead, continued progress in EU-U.S. trade talks could further lift risk appetite and extend the equity rally, while potentially stabilizing the declining dollar. Earnings from other members of the so-called “Magnificent Seven” could also provide additional upside catalysts in the near term.
Technical Analysis
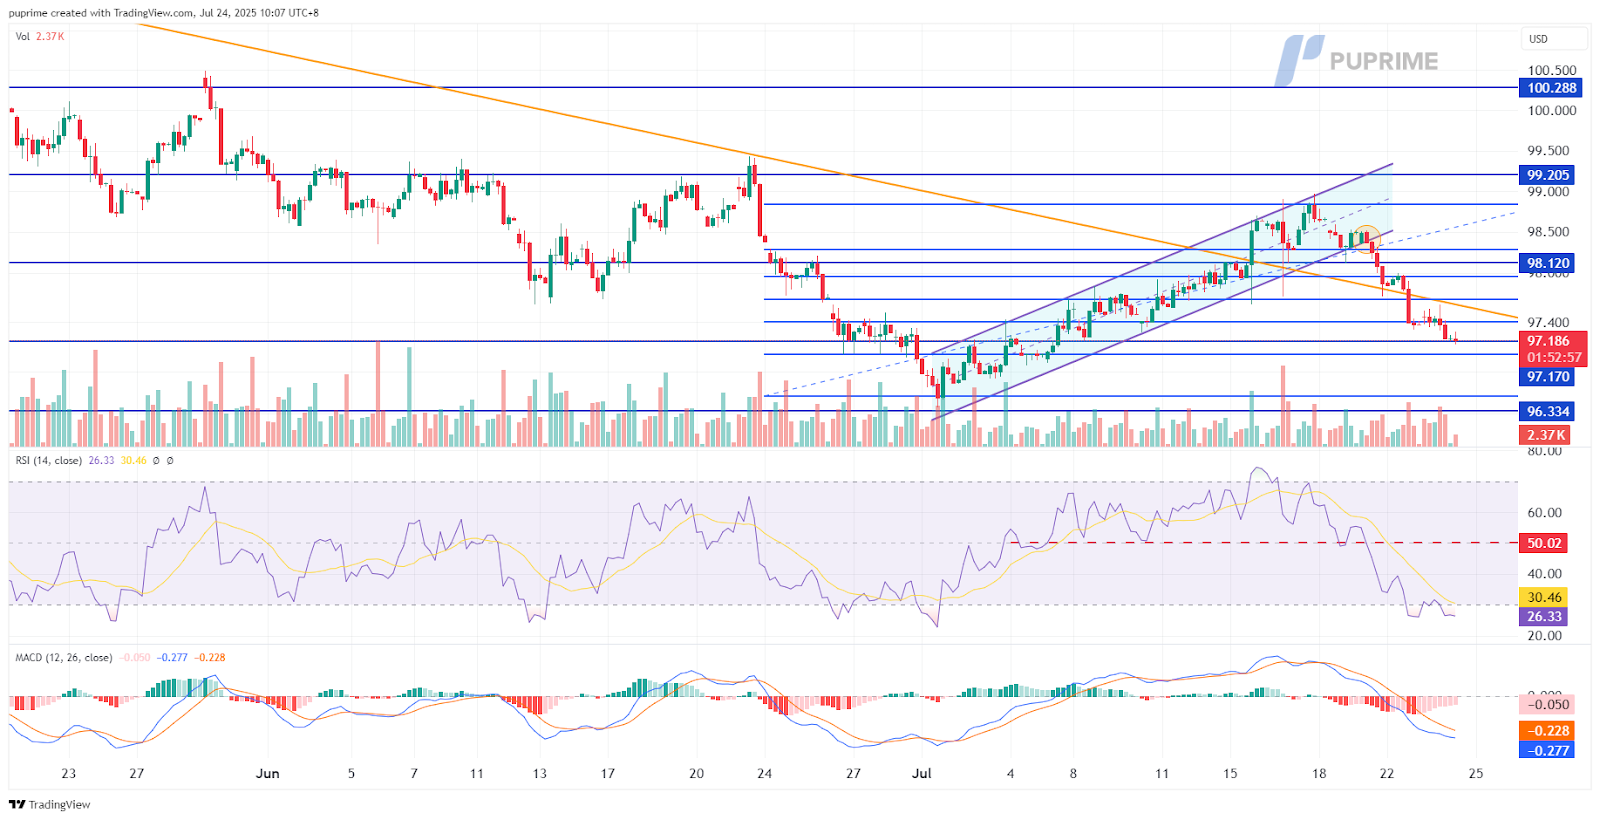
DXY, H4:
The U.S. Dollar Index (DXY) is under sustained selling pressure, sliding more than 1% since the start of the week as bearish momentum intensifies. The index has decisively broken below its prior uptrend channel, signaling a potential trend reversal. Further downside was confirmed as DXY failed to hold above the long-term downtrend resistance and breached the 61.8% Fibonacci retracement level from its previous rally—reinforcing the bearish bias.
Momentum indicators align with the downbeat outlook. The Relative Strength Index (RSI) has slipped into oversold territory, while the MACD has crossed below the zero line, both pointing to strengthening downside momentum.
Unless a near-term catalyst emerges to halt the decline, the technical breakdown suggests the dollar may remain under pressure in the coming sessions.
Resistance Levels: 98.12, 99.20
Support Levels: 96.35, 95.65
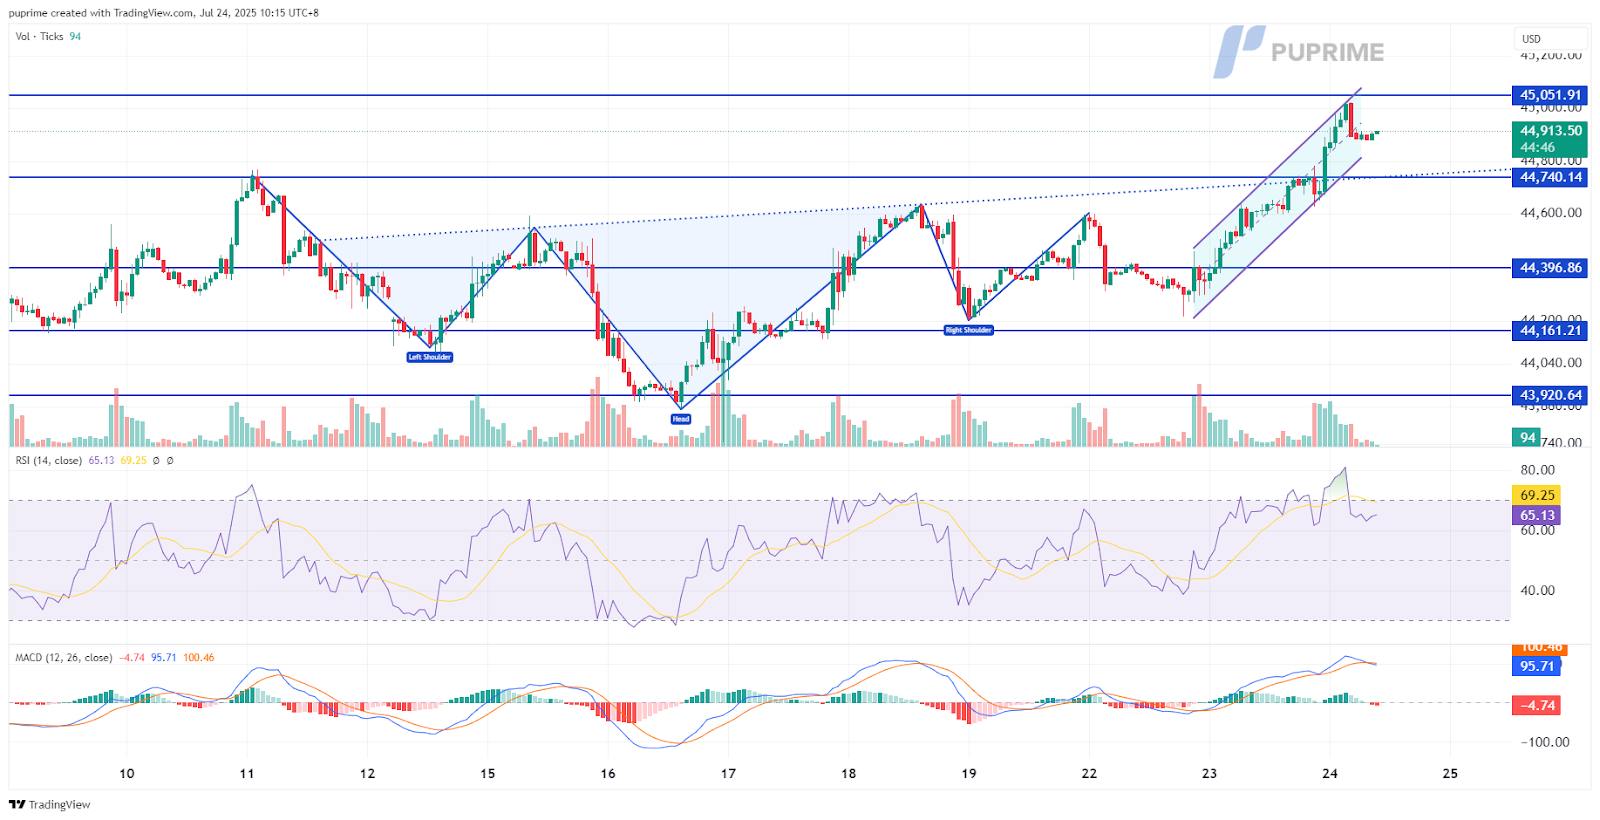
The Dow Jones Industrial Average has surged over 1.3% across the past two sessions, carving out a steep uptrend channel and lifting the index toward its all-time high above the 45,000 level. The move underscores strong bullish momentum, driven in part by robust market sentiment and favorable earnings expectations.
Momentum indicators confirm the upward bias, with the Relative Strength Index (RSI) firmly in overbought territory, suggesting sustained buying pressure. However, the MACD has also edged higher but now shows signs of a potential bearish crossover above the signal line, raising the prospect of a short-term technical pullback.
While the broader trend remains bullish, traders may exercise caution in the near term as overextended conditions hint at the possibility of a brief consolidation or retracement.
Resistance Levels: 45,050.00, 45,330.00
Support Levels: 44740.00, 44,400.00
Step into the world of trading with confidence today. Open a free PU Prime live CFD trading account now to experience real-time market action, or refine your strategies risk-free with our demo account.
This content is for educational and informational purposes only and should not be considered investment advice, a personal recommendation, or an offer to buy or sell any financial instruments.
This material has been prepared without considering any individual investment objectives, financial situations. Any references to past performance of a financial instrument, index, or investment product are not indicative of future results.
PU Prime makes no representation as to the accuracy or completeness of this content and accepts no liability for any loss or damage arising from reliance on the information provided. Trading involves risk, and you should carefully consider your investment objectives and risk tolerance before making any trading decisions. Never invest more than you can afford to lose.

Trade forex, indices, metal, and more at industry-low spreads and lightning-fast execution.
Sign up for a PU Prime Live Account with our hassle-free process.
Effortlessly fund your account with a wide range of channels and accepted currencies.
Access hundreds of instruments under market-leading trading conditions.
Trading Platforms
Learn
About PU Prime
Corporate

Please note the Website is intended for individuals residing in jurisdictions where accessing the Website is permitted by law.
Please note that PU Prime and its affiliated entities are neither established nor operating in your home jurisdiction.
By clicking the "Acknowledge" button, you confirm that you are entering this website solely based on your initiative and not as a result of any specific marketing outreach. You wish to obtain information from this website which is provided on reverse solicitation in accordance with the laws of your home jurisdiction.
Thank You for Your Acknowledgement!
Ten en cuenta que el sitio web está destinado a personas que residen en jurisdicciones donde el acceso al sitio web está permitido por la ley.
Ten en cuenta que PU Prime y sus entidades afiliadas no están establecidas ni operan en tu jurisdicción de origen.
Al hacer clic en el botón "Aceptar", confirmas que estás ingresando a este sitio web por tu propia iniciativa y no como resultado de ningún esfuerzo de marketing específico. Deseas obtener información de este sitio web que se proporciona mediante solicitud inversa de acuerdo con las leyes de tu jurisdicción de origen.
Thank You for Your Acknowledgement!